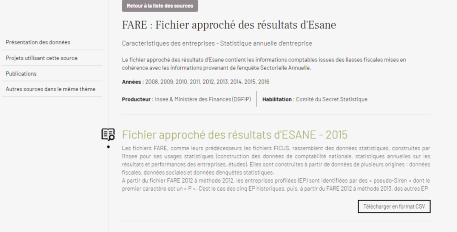
To answer these questions, we have designed new functionalities on our website to present the work carried out on the CASD according to the following three axes:
– project descriptions,
– the data sources used,
– and the publications produced.
This makes it easy to navigate between projects, data and publications. For example, it is possible to sort the data sources according to the number of projects using them or the number of publications produced.
It also provides producers with feedback on the use of their data. They will thus be able to have publications associated with their data and the themes for which they are most used.
For researchers, this allows them to see who is working or has worked on data that may potentially be of interest to them.
The documentation of data sources is gradually being put online and a list of variables is already available from many sources.


